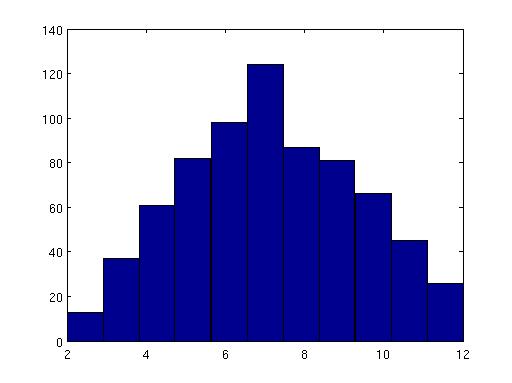
% matlab code to roll a pair of dice N times and look at the
% mean, standard deviation and distribution of the results

N=720;
die1=randi([1,6],[N,1]);
die2=randi([1,6],[N,1]);
x = die1 + die2;

mean(x)
std(x)
hist(x,11)
Get answers 7.1375 (expect around 7) and 2.4322 (expect sqrt(6) = 2.4495).
Expect frequencies 20,40,60,80,100,120,100,80,60,40,20 ... get this more or less, see the histogram:
% matlab code to do 500 series of coin tosses
% recording for each one how many tosses necessary
% until get 3 heads in a row
N=500; % number of experiments
x=zeros(N,1); % answers will go in here
for i=1:N
% toss first 3 coins
z1=randi([0,1]);
z2=randi([0,1]);
z3=randi([0,1]);
x(i)=3;
% so long as one of the current coins is zero, toss again
while z1*z2*z3==0
z1=z2;
z2=z3;
z3=randi([0,1]);
x(i)=x(i)+1;
end
end
% look at the mean, standard deviation and distribution of results
mean(x)
std(x)
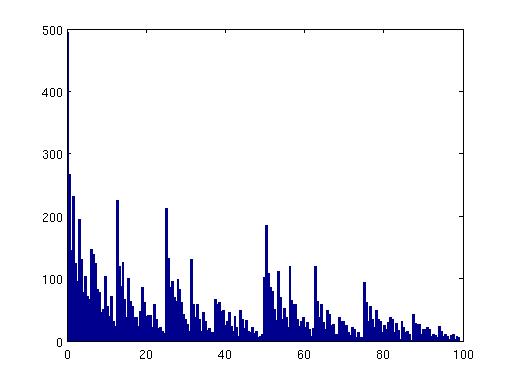
hist(x,20)
Got mean 13.9780, standard deviation 10.5812. Histogram:
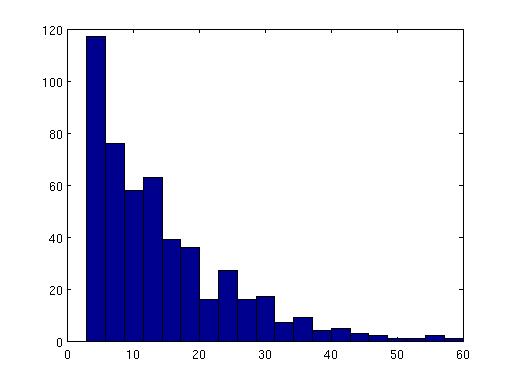
Such "falling" distributions are often described by a single "rate" parameter saying how far it is necessary to advance in "x" before the frequency drops by a factor of 2 (or in fact 1/e). If there is nonuniform fall-off more than 1 parameter is needed. The rate of decay of the tail is particularly interesting (there are "thin tails" and "fat tails").
% matlab code to roll three dice N times
%             to look at the sum, the lowest and the highest
%             to look at the means, s.d.s and correlations

N=500;
die1=randi([1,6],[N,1]);
die2=randi([1,6],[N,1]);
die3=randi([1,6],[N,1]);
sum = die1 + die2 + die3 ;
high = max( [die1,die2,die3], [] , 2 );
low  = min( [die1,die2,die3], [] , 2 );

mean([high,low,sum])
std([high,low,sum])
corrcoef([high,low,sum])
Answers:
           4.8960    2.0540   10.3460  (should be 5,2,10.5)
           1.1627    1.1427    2.9590  (first 2 should be equal)
           0.2712    0.7508    0.7644  (last 2 should be equal)


We see the s.d. of high and low is smaller than that of the sum, as less range.  Relative to range, the s.d. of the sum is smaller than that of the other 2. High does not affect low as much as high or low affect sum.
P1=[0 0];
P2=[50 100];
P3=[100 0];
N=10000;
p=zeros(N,2);
p(1,:)=P1; % start at one of the points
z=randi([1,3],[N-1,1]);
for i=1:(N-1)
if z(i)==1
p(i+1,:)=1/2*(P1+p(i,:));
elseif z(i)==2
p(i+1,:)=1/2*(P2+p(i,:));
elseif z(i)==3
p(i+1,:)=1/2*(P3+p(i,:));
end
end
figure(1)
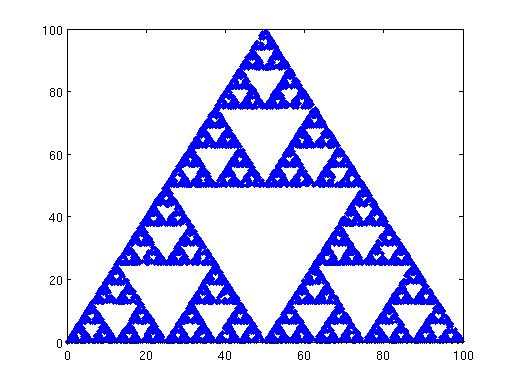
plot(p(:,1),p(:,2),'.')
figure(2)
hist(p(:,1),200)
figure(3)
hist(p(:,2),200)
mean(p(:,1)) % 49.3392
std(p(:,1)) % 23.6330
mean(p(:,2)) % 32.9841
std(p(:,2)) % 27.0567
Plot of points:
Histogram of x values:
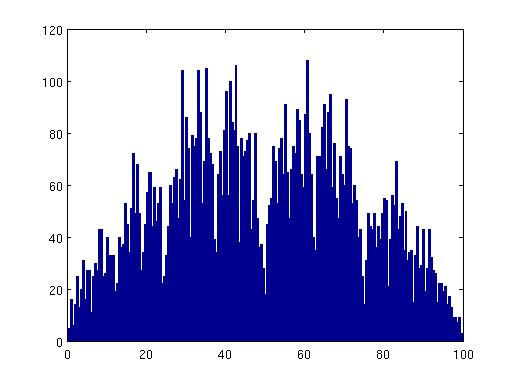
Histogram of y values:
Both distributions of x and y have a fractal nature but the x distribution is much better described as having a "center" and a "spread" - even if the density seems to go to 0 at x=0.5.