n=100000;
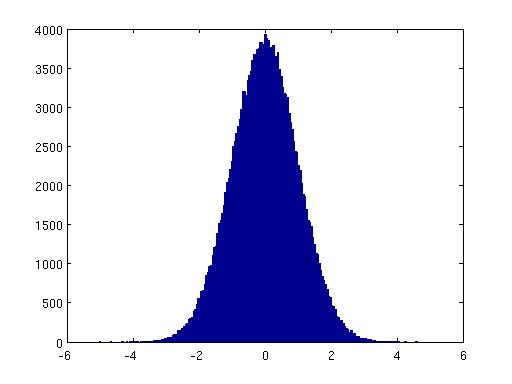
% first method
U=rand(n,12);
N=zeros(n,1);
for i=1:n
N(i)=sum(U(i,:))-6;
end
figure(1)
hist(N,200);
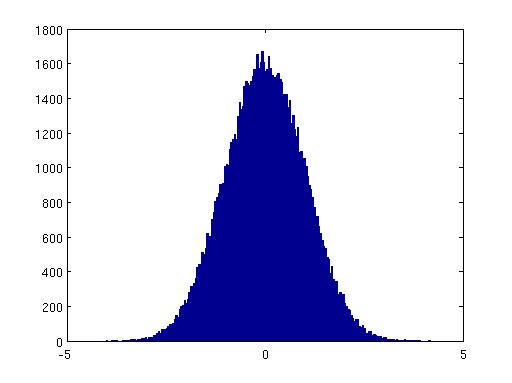
% second method
x=rand(n,1);
y=rand(n,1);
r=sqrt(-2*log(x));
theta=2*pi*y;
u=r.*cos(theta);
v=r.*sin(theta);
N=[u;v];
figure(2)
hist(N,200);
% third method
x=zeros(n,1);
y=zeros(n,1);
for i=1:n;
X=2*rand-1;
Y=2*rand-1;
while ((X^2+Y^2)>1);
X=2*rand-1;
Y=2*rand-1;
end
x(i)=X;
y(i)=Y;
end
rsq=x.^2+y.^2;
A=sqrt(-2*log(rsq)./rsq);
u=A.*x;
v=A.*y;
N=[u;v];
figure(3)
hist(N,200);
The 3 plots look very similar, just in the first case we have n normal variates
and the second and third we have 2n.