sigma=[0.1:0.02:0.6];
prob=zeros(size(sigma));
Tmax=10;
N=200;
h=Tmax/N;
t=0:h:Tmax;
M=10000;
Z=randn(M,N);
for k=1:length(sigma)
X=[0.5*ones(M,1),zeros(M,N)];
sig=sigma(k);
for j=1:M
for i=1:N
if (abs(X(j,i))<10)
X(j,i+1)=X(j,i)+h*X(j,i)*(1-X(j,i))+sig*sqrt(h)*Z(j,i);
else
X(j,i+1)=10;
end
end
end
prob(k)=sum(X(:,N+1)==10)/M;
end
figure (1)
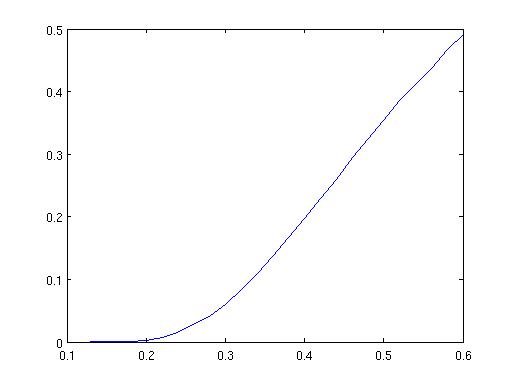
plot(sigma,prob);
Running gave the following plot
We expect the probability of divergence to increase with sigma - higher fluctuations gives more chance of divergence.
Back to main course page
Back to my main teaching page
Back to my home page